20 Comparison Report: Brain/MB
- Cancer Category: blastomas
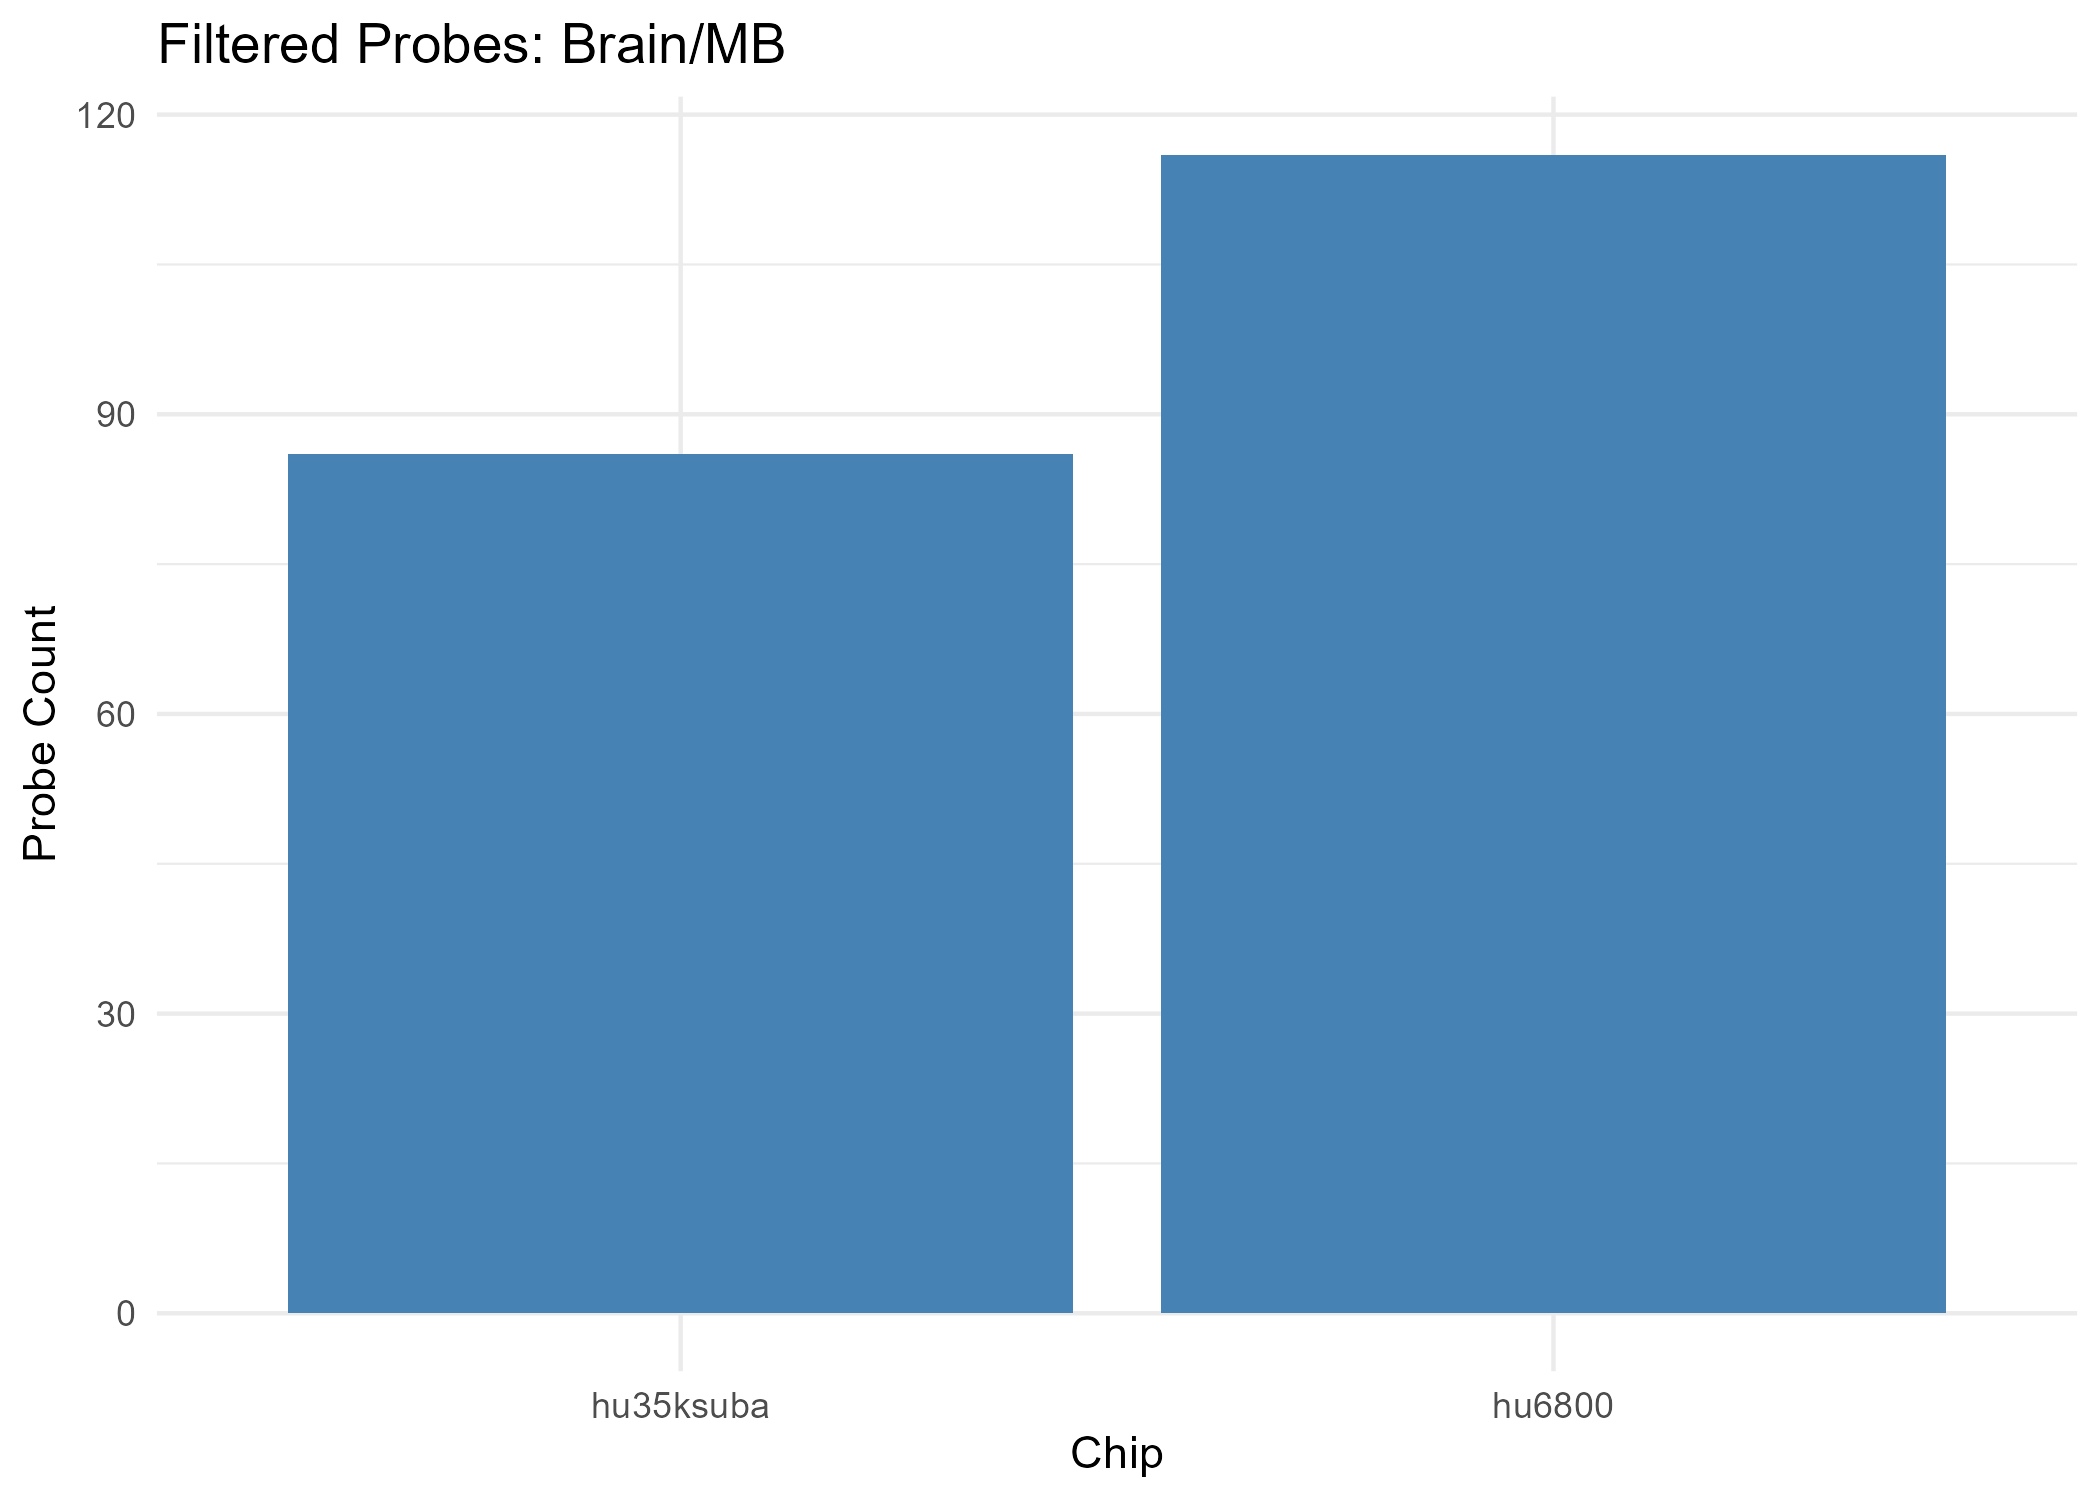
- Chip hu35ksuba: 828 filtered probes
- Chip hu6800: 650 filtered probes
Overall Complexity & Entropy Assessment
| Measure | All Filtered Probes | GO MF Terms | KEGG Pathways | HALLMARK Genes |
|---|---|---|---|---|
| Complexity | strong loss (uncertain) | () | strong loss (uncertain) | strong loss (well supported) |
| Shannon Entropy | no clear change (uncertain) | () | no clear change (well supported) | no clear change (moderately supported) |
| Spectral Entropy | no clear change (uncertain) | () | strongly anti-chaotic (moderately supported) | no clear change (moderately supported) |
Notes - Gain = increased complexity from normal to tumor
- Loss = complexity reduction from normal to tumor
- Chaotic = increased entropy from normal to tumor
- Anti-Chaotic = entropy reduction from normal to tumor
- All p-values unadjusted unless noted
Gain Complexity Clusters
| Cluster | # Terms | p-value | Representative Terms |
|---|---|---|---|
| 10 | 2 | 0.018 | brain development; substantia nigra development |
| 16 | 3 | 0.035 | regulation of gene expression; positive regulation of gene expression; positive regulation of gene expression |
| 54 | 2 | 0.117 | positive regulation of cell differentiation; positive regulation of myoblast differentiation |
| 51 | 2 | 0.315 | negative regulation of apoptotic process; negative regulation of neuron apoptotic process |
| 52 | 2 | 0.405 | positive regulation of MAPK cascade; positive regulation of protein kinase B signaling |
| 6 | 3 | 0.897 | apoptotic process; apoptotic process; neuron apoptotic process |
| * Combined p-values are computed using Fisher’s method (sumlog) across the GO terms in each cluster. |
Loss Complexity Clusters
| Cluster | # Terms | p-value | Representative Terms |
|---|---|---|---|
| 22 | 1 | 0.006 | mitochondrial respiratory chain complex I assembly |
| 3 | 2 | 0.008 | mitochondrial electron transport, NADH to ubiquinone; mitochondrial electron transport, cytochrome c to oxygen |
| 2 | 1 | 0.011 | protein polyubiquitination |
| 36 | 1 | 0.011 | generation of precursor metabolites and energy |
| 47 | 1 | 0.015 | cerebral cortex development |
| 24 | 2 | 0.023 | innate immune response; innate immune response |
| 13 | 2 | 0.031 | aerobic respiration; cellular respiration |
| 34 | 1 | 0.041 | neuron migration |
| 7 | 5 | 0.279 | signal transduction; G protein-coupled receptor signaling pathway; signal transduction |
| 26 | 4 | 0.377 | positive regulation of transcription, DNA-templated; positive regulation of transcription by RNA polymerase II; positive regulation of transcription, DNA-templated |
| 1 | 5 | 0.394 | negative regulation of transcription by RNA polymerase II; regulation of transcription, DNA-templated; regulation of transcription by RNA polymerase II |
| 29 | 2 | 0.518 | proton transmembrane transport; proton transmembrane transport |
| 9 | 2 | 0.545 | nervous system development; nervous system development |
| 17 | 2 | 0.740 | positive regulation of neuron projection development; positive regulation of neuron projection development |
| 11 | 2 | 0.836 | positive regulation of cell population proliferation; positive regulation of cell population proliferation |
| 35 | 2 | 0.987 | cytoplasmic translation; translation |
| * Combined p-values are computed using Fisher’s method (sumlog) across the GO terms in each cluster. |
Mixed Complexity Clusters
| Cluster | # Terms | p-value | Representative Terms |
|---|---|---|---|
| 30 | 2 | 0.046 | MAPK cascade; intracellular signal transduction |
| * Combined p-values are computed using Fisher’s method (sumlog) across the GO terms in each cluster. |
⚠️ Table not available.
Significant GO Molecular Function Terms (Complexity)
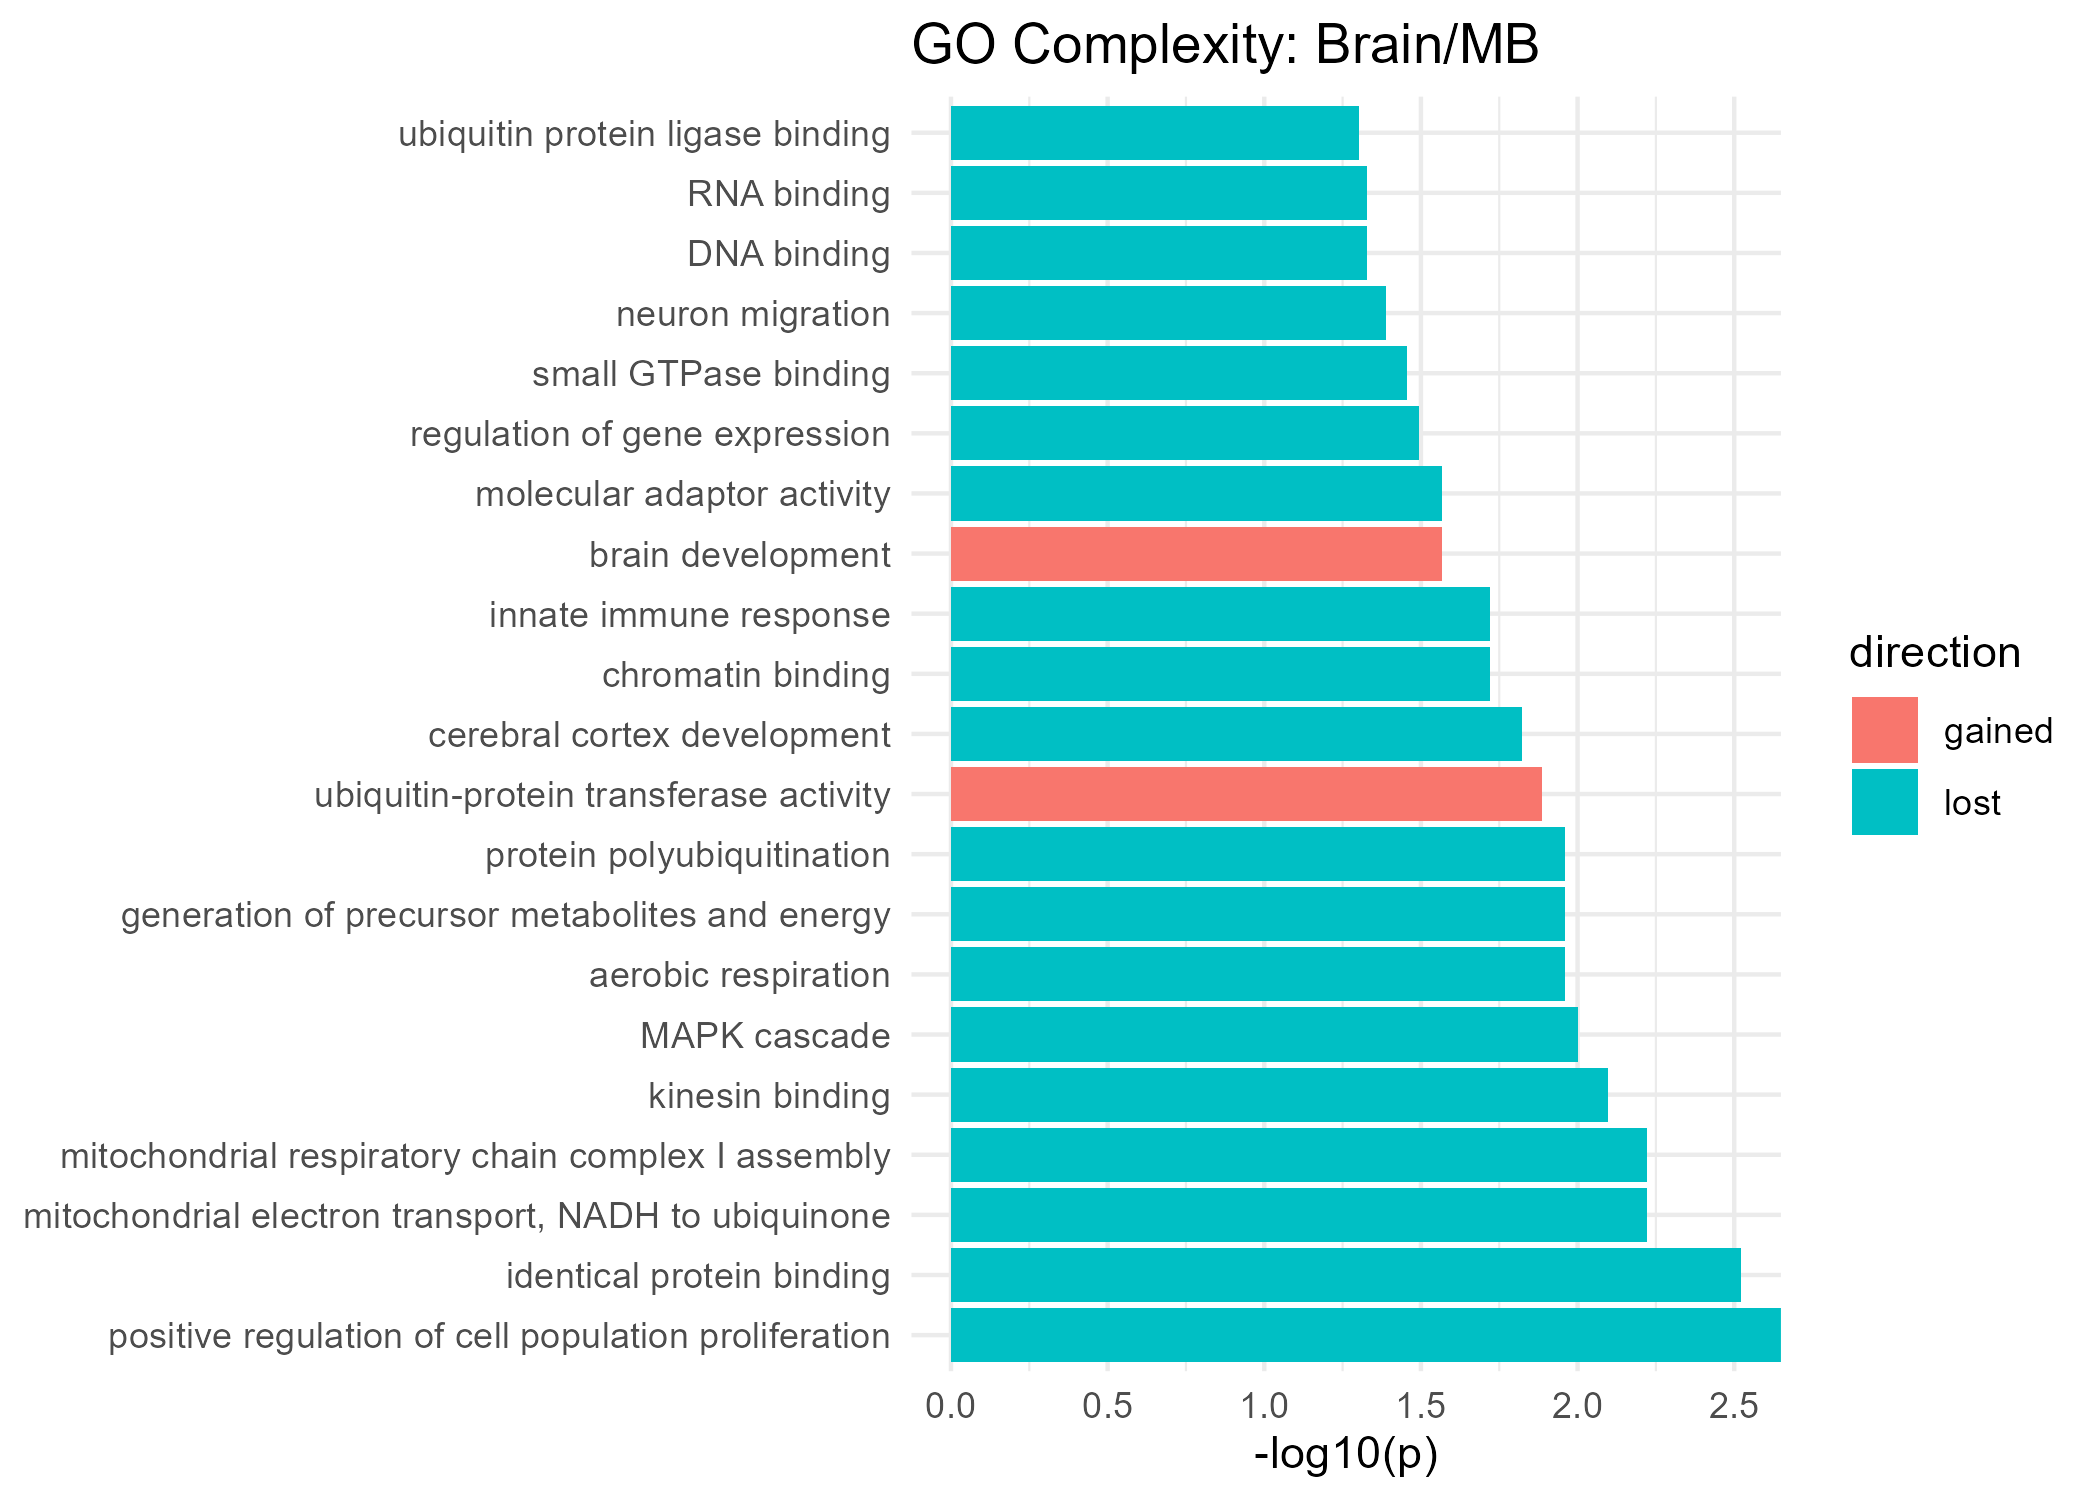
Gained Complexity
| GeneSet | p-value |
|---|---|
| brain development | 0.027 |
| ubiquitin-protein transferase activity | 0.013 |
Lost Complexity
| GeneSet | p-value |
|---|---|
| DNA binding | 0.047 |
| MAPK cascade | 0.010 |
| RNA binding | 0.047 |
| aerobic respiration | 0.011 |
| cerebral cortex development | 0.015 |
| chromatin binding | 0.019 |
| generation of precursor metabolites and energy | 0.011 |
| identical protein binding | 0.003 |
| innate immune response | 0.019 |
| kinesin binding | 0.008 |
| mitochondrial electron transport, NADH to ubiquinone | 0.006 |
| mitochondrial respiratory chain complex I assembly | 0.006 |
| molecular adaptor activity | 0.027 |
| neuron migration | 0.041 |
| positive regulation of cell population proliferation | 0.000 |
| protein polyubiquitination | 0.011 |
| regulation of gene expression | 0.032 |
| small GTPase binding | 0.035 |
| ubiquitin protein ligase binding | 0.050 |
Significant GO Molecular Function Terms (Spectral Entropy)
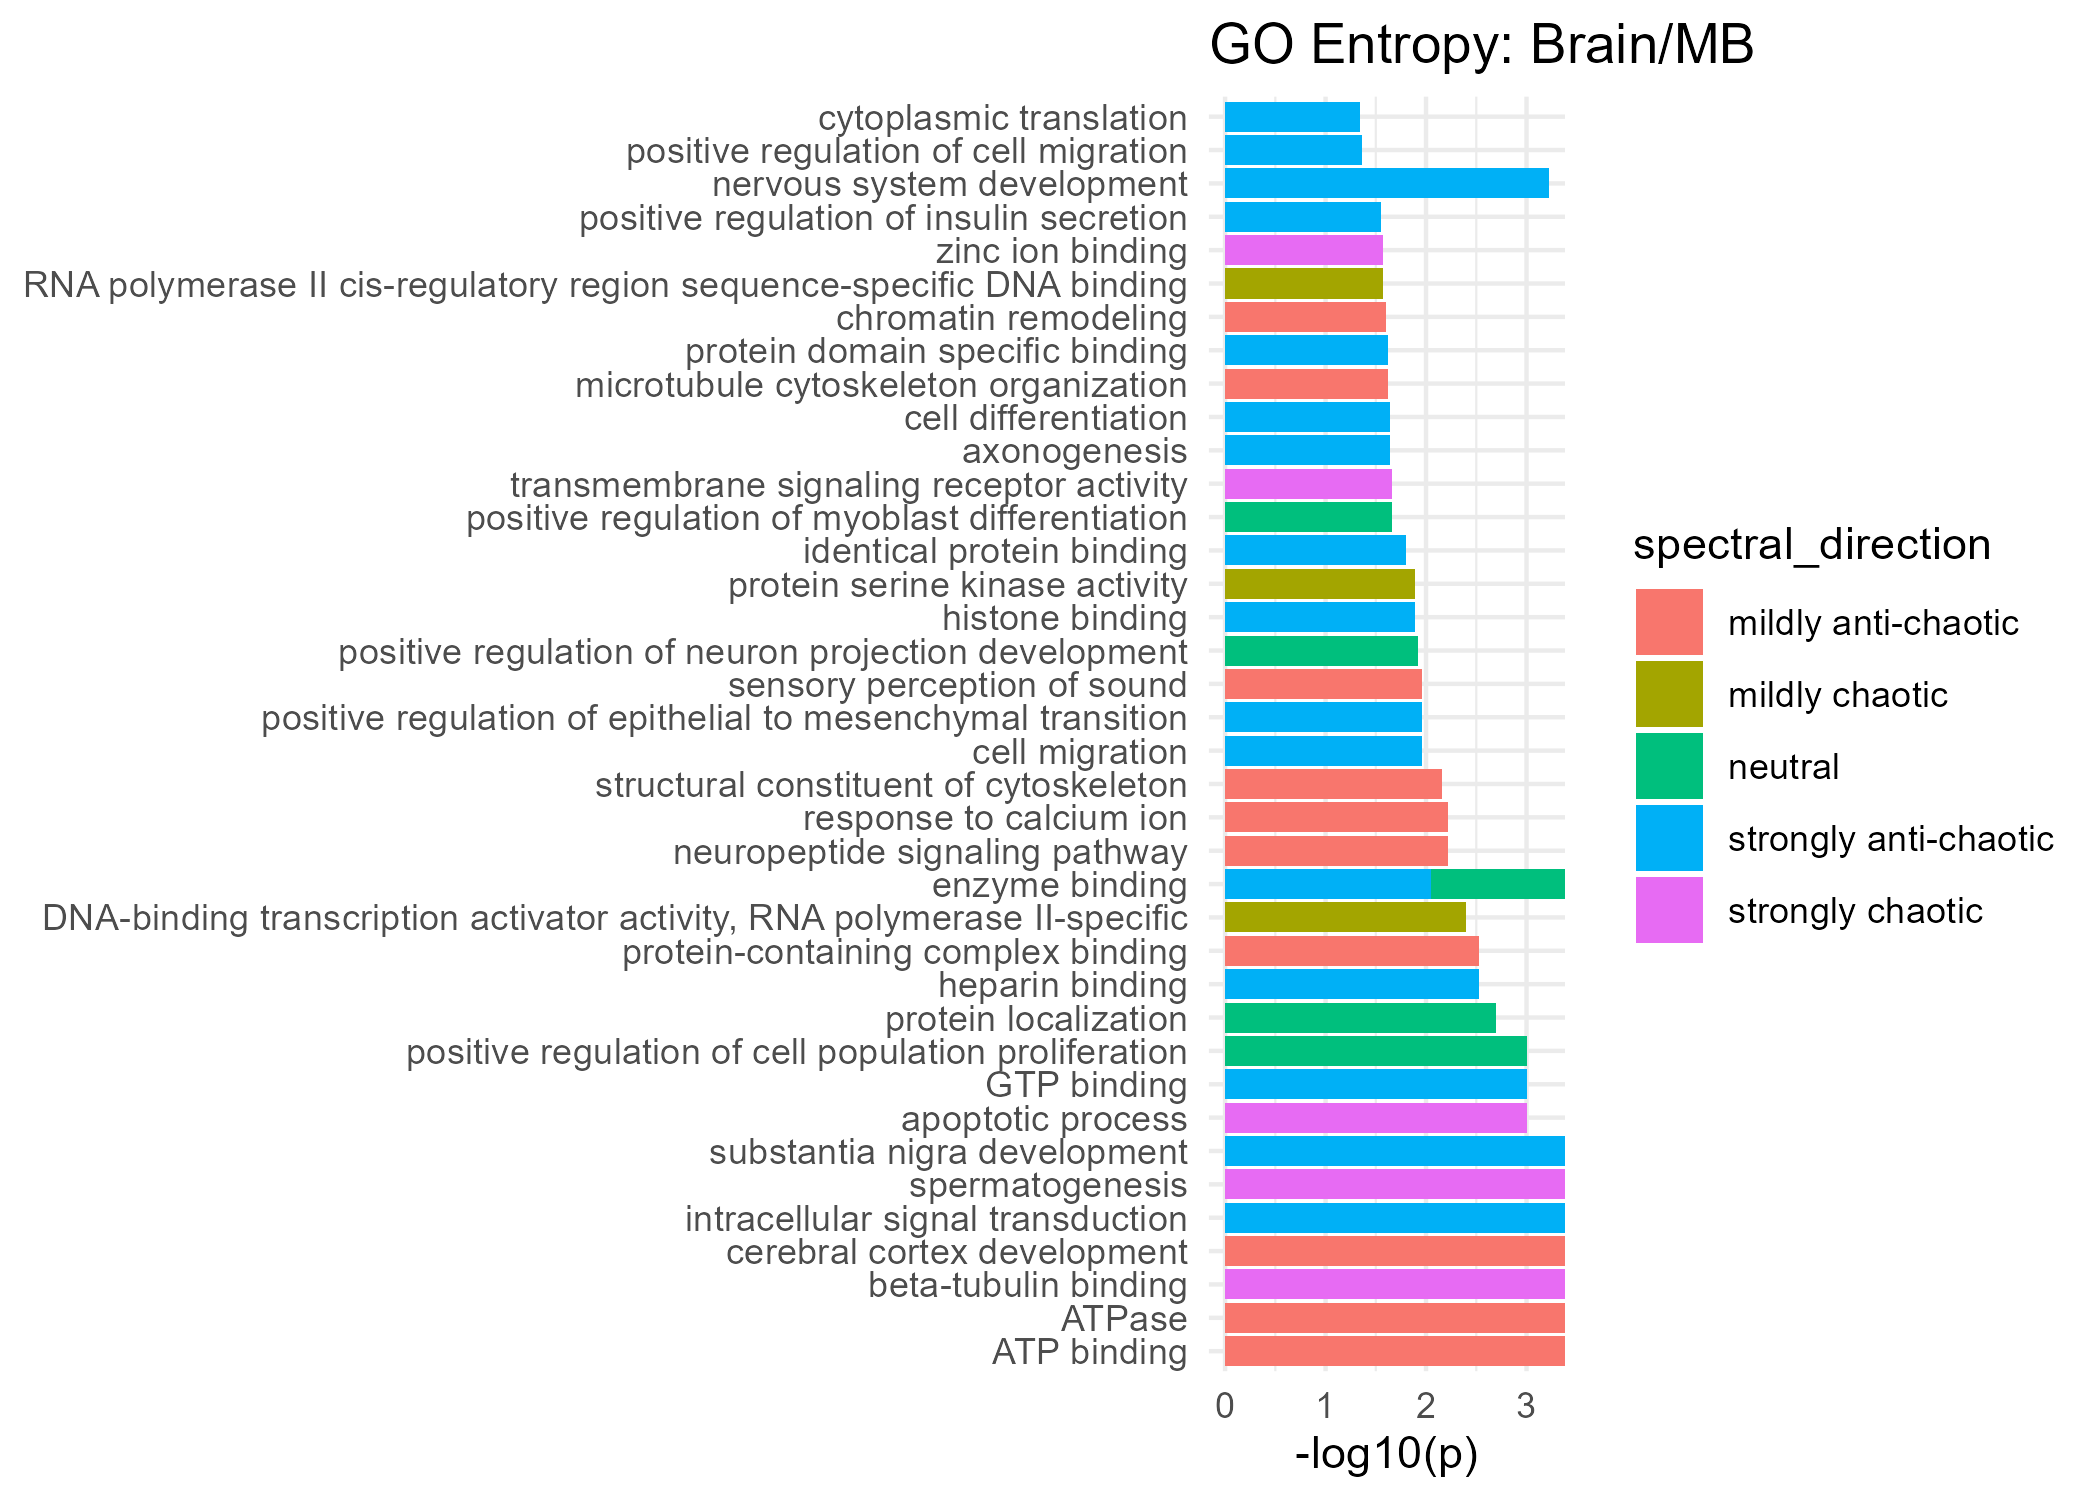
Strongly Anti-Chaotic
| GeneSet | p-value |
|---|---|
| GTP binding | 0.001 |
| axonogenesis | 0.023 |
| cell differentiation | 0.023 |
| cell migration | 0.011 |
| cytoplasmic translation | 0.045 |
| enzyme binding | 0.009 |
| heparin binding | 0.003 |
| histone binding | 0.013 |
| identical protein binding | 0.016 |
| intracellular signal transduction | 0.000 |
| nervous system development | 0.012 |
| nervous system development | 0.050 |
| positive regulation of cell migration | 0.043 |
| positive regulation of epithelial to mesenchymal transition | 0.011 |
| positive regulation of insulin secretion | 0.028 |
| protein domain specific binding | 0.024 |
| substantia nigra development | 0.000 |
Mildly Anti-Chaotic
| GeneSet | p-value |
|---|---|
| ATP binding | 0.000 |
| ATPase | 0.000 |
| cerebral cortex development | 0.000 |
| chromatin remodeling | 0.025 |
| microtubule cytoskeleton organization | 0.024 |
| neuropeptide signaling pathway | 0.006 |
| protein-containing complex binding | 0.003 |
| response to calcium ion | 0.006 |
| sensory perception of sound | 0.011 |
| structural constituent of cytoskeleton | 0.007 |
Neutral
| GeneSet | p-value |
|---|---|
| enzyme binding | 0.000 |
| positive regulation of cell population proliferation | 0.001 |
| positive regulation of myoblast differentiation | 0.022 |
| positive regulation of neuron projection development | 0.012 |
| protein localization | 0.002 |
Mildly Chaotic
| GeneSet | p-value |
|---|---|
| DNA-binding transcription activator activity, RNA polymerase II-specific | 0.004 |
| RNA polymerase II cis-regulatory region sequence-specific DNA binding | 0.027 |
| protein serine kinase activity | 0.013 |
Strongly Chaotic
| GeneSet | p-value |
|---|---|
| apoptotic process | 0.001 |
| beta-tubulin binding | 0.000 |
| spermatogenesis | 0.000 |
| transmembrane signaling receptor activity | 0.022 |
| zinc ion binding | 0.027 |
Significant KEGG Pathways (Complexity)
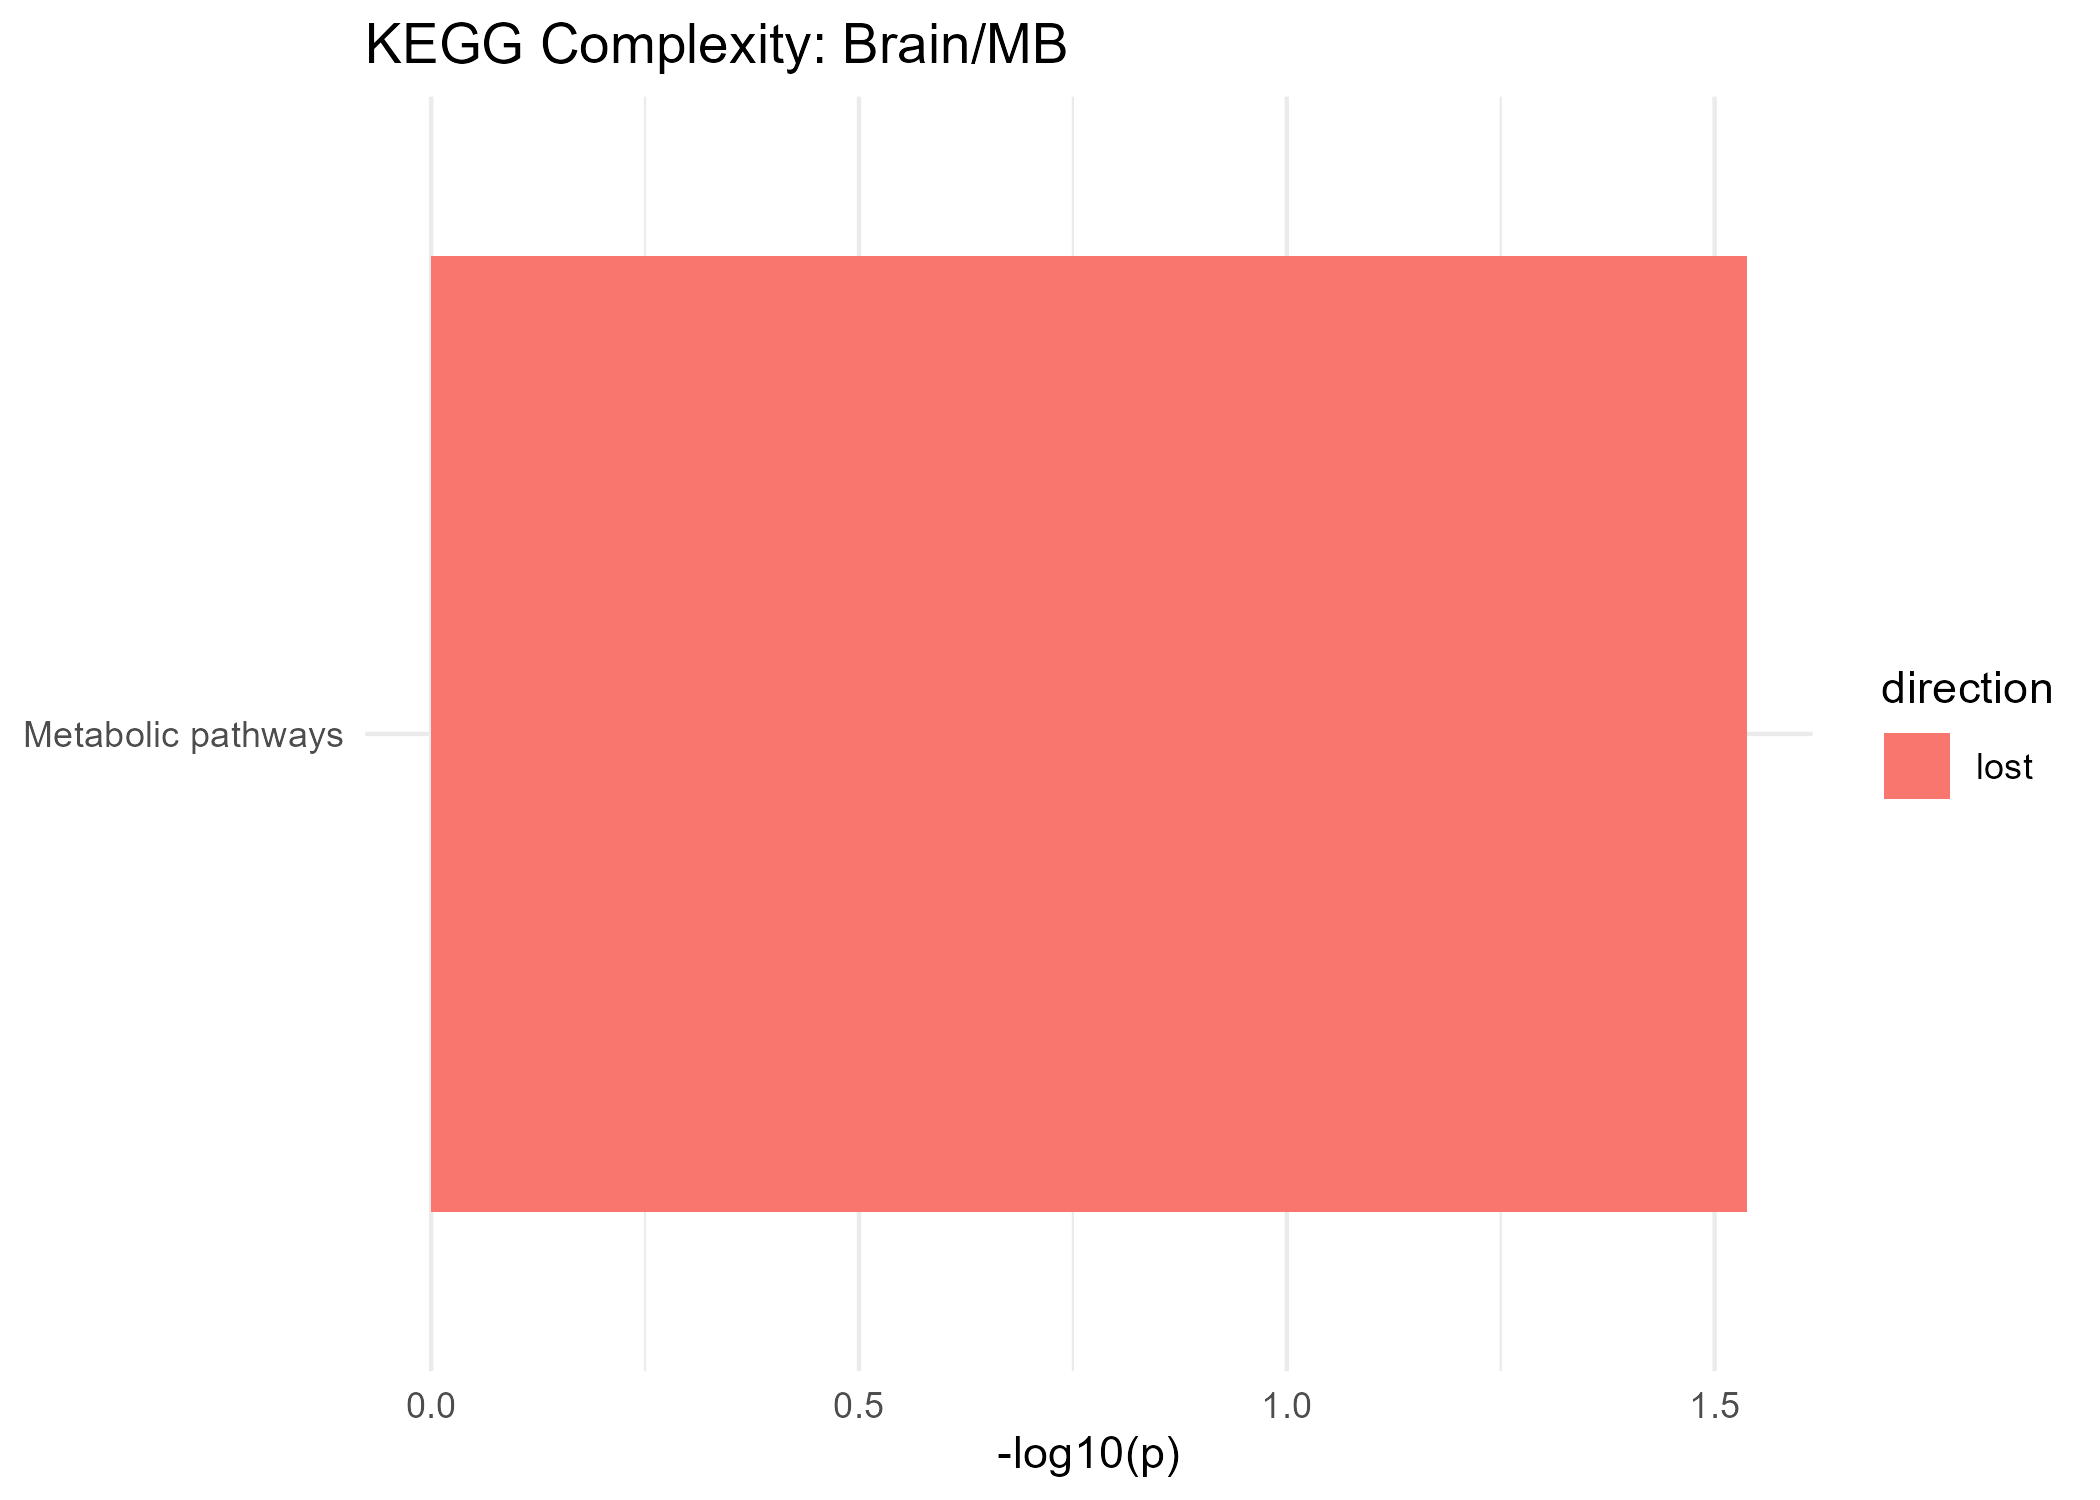
Lost Complexity
| GeneSet | p-value | Cancer Pathway |
|---|---|---|
| Metabolic pathways | 0.029 | |
| Pathways in cancer | 0.923 | ✅ |
Significant KEGG Pathways (Spectral Entropy)
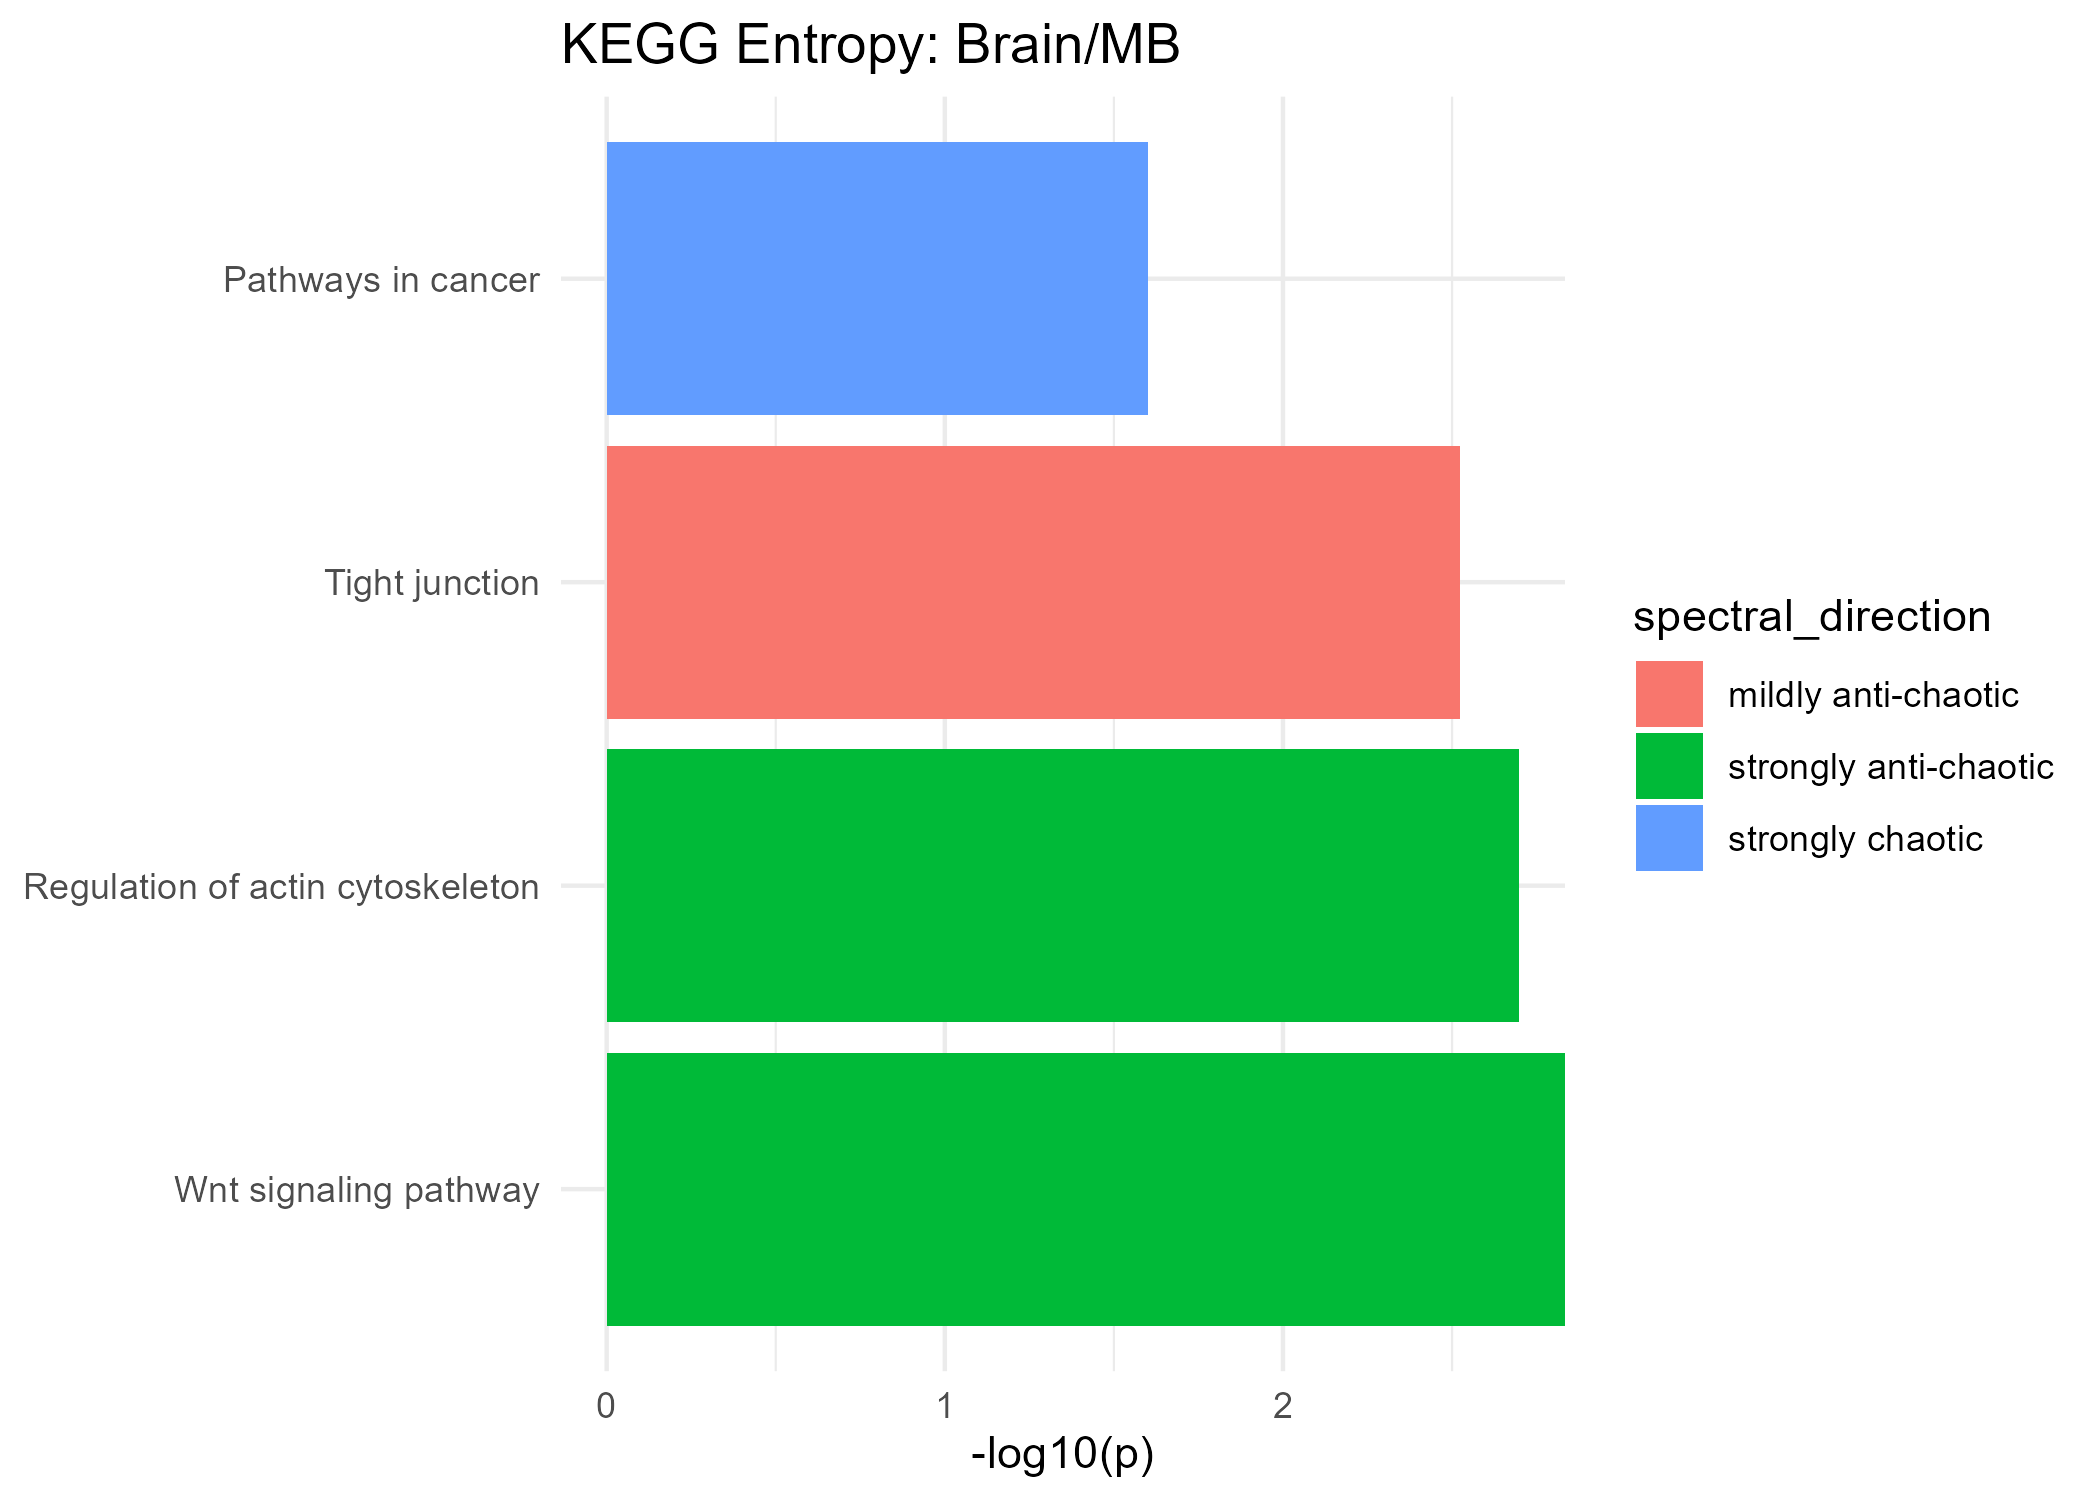
Strongly Anti-Chaotic
| GeneSet | p-value | Cancer Pathway |
|---|---|---|
| Regulation of actin cytoskeleton | 0.002 | |
| Wnt signaling pathway | 0.000 |
Mildly Anti-Chaotic
| GeneSet | p-value | Cancer Pathway |
|---|---|---|
| Tight junction | 0.003 |
Strongly Chaotic
| GeneSet | p-value | Cancer Pathway |
|---|---|---|
| Pathways in cancer | 0.025 | ✅ |
Significant HALLMARK Genes (Complexity)
Lost Complexity
| GeneSet | p-value |
|---|---|
| HALLMARK_HYPOXIA | 0.002 |
| HALLMARK_MYOGENESIS | 0.041 |
Significant HALLMARK Genes (Spectral Entropy)
Mildly Anti-Chaotic
| GeneSet | p-value |
|---|---|
| HALLMARK_MYC_TARGETS_V1 | 0.002 |