14 Comparison Report: KID/RCC
- Cancer Category: carcinomas
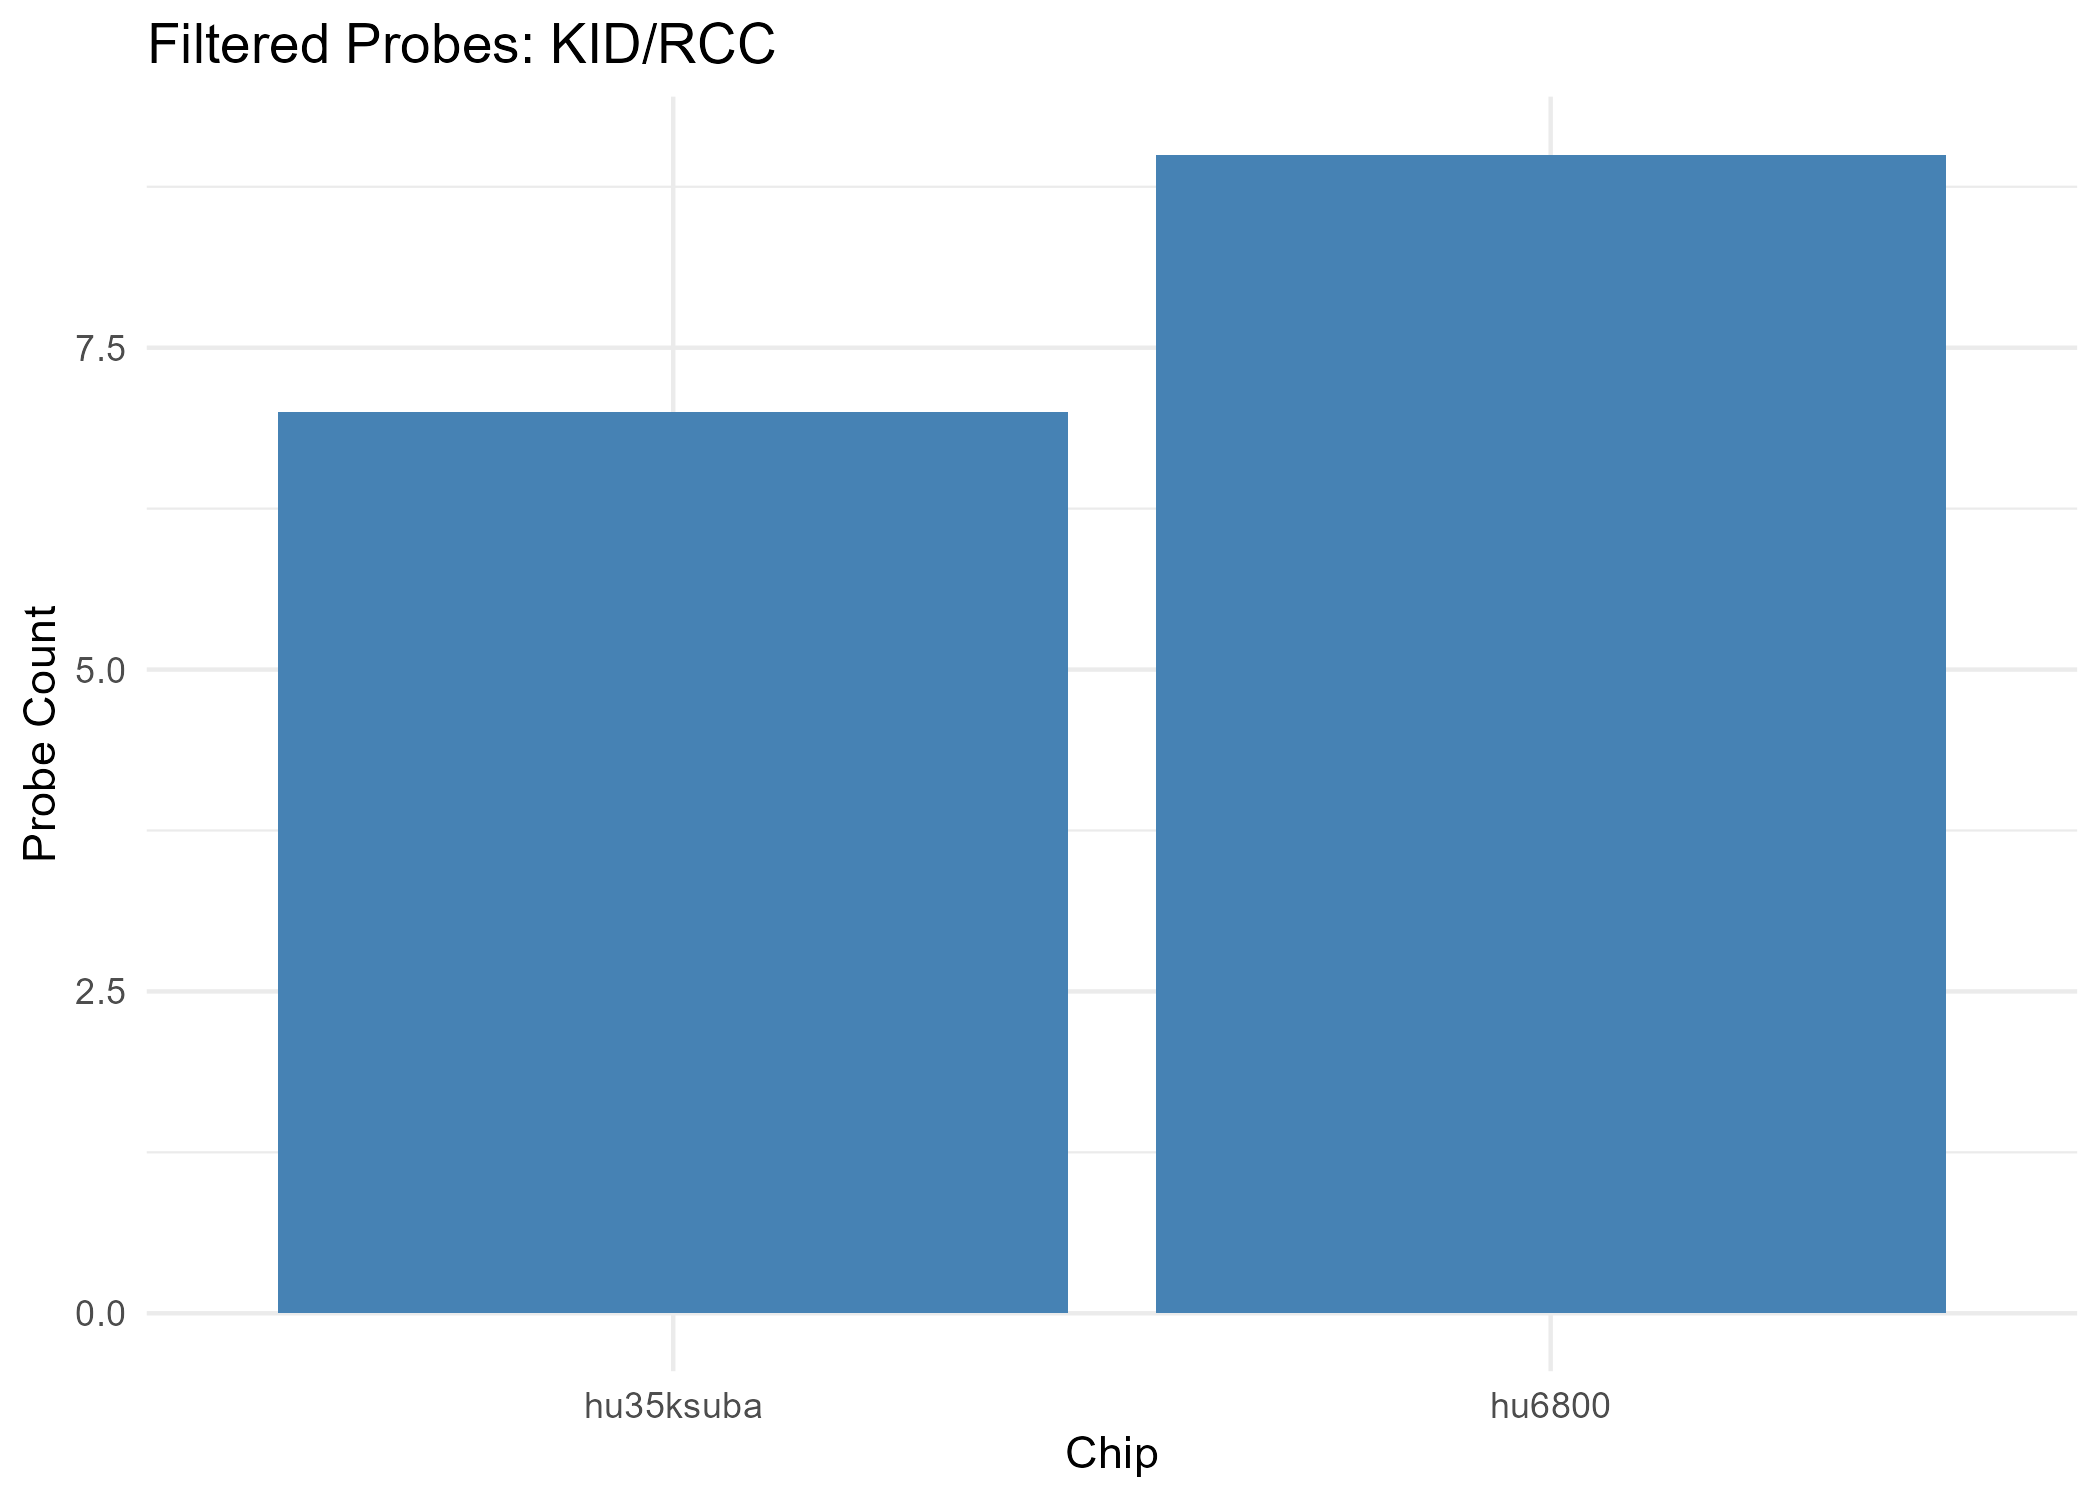
- Chip hu35ksuba: 330 filtered probes
- Chip hu6800: 57 filtered probes
Overall Complexity & Entropy Assessment
| Measure | All Filtered Probes | GO MF Terms | KEGG Pathways | HALLMARK Genes |
|---|---|---|---|---|
| Complexity | strong gain (uncertain) | () | strong loss (uncertain) | strong loss (well supported) |
| Shannon Entropy | no clear change (uncertain) | () | no clear change (uncertain) | no clear change (uncertain) |
| Spectral Entropy | no clear change (uncertain) | () | no clear change (uncertain) | mildly chaotic (uncertain) |
Notes - Gain = increased complexity from normal to tumor
- Loss = complexity reduction from normal to tumor
- Chaotic = increased entropy from normal to tumor
- Anti-Chaotic = entropy reduction from normal to tumor
- All p-values unadjusted unless noted
No significant GO clusters found.
⚠️ Table not available.
Significant GO Molecular Function Terms (Complexity)
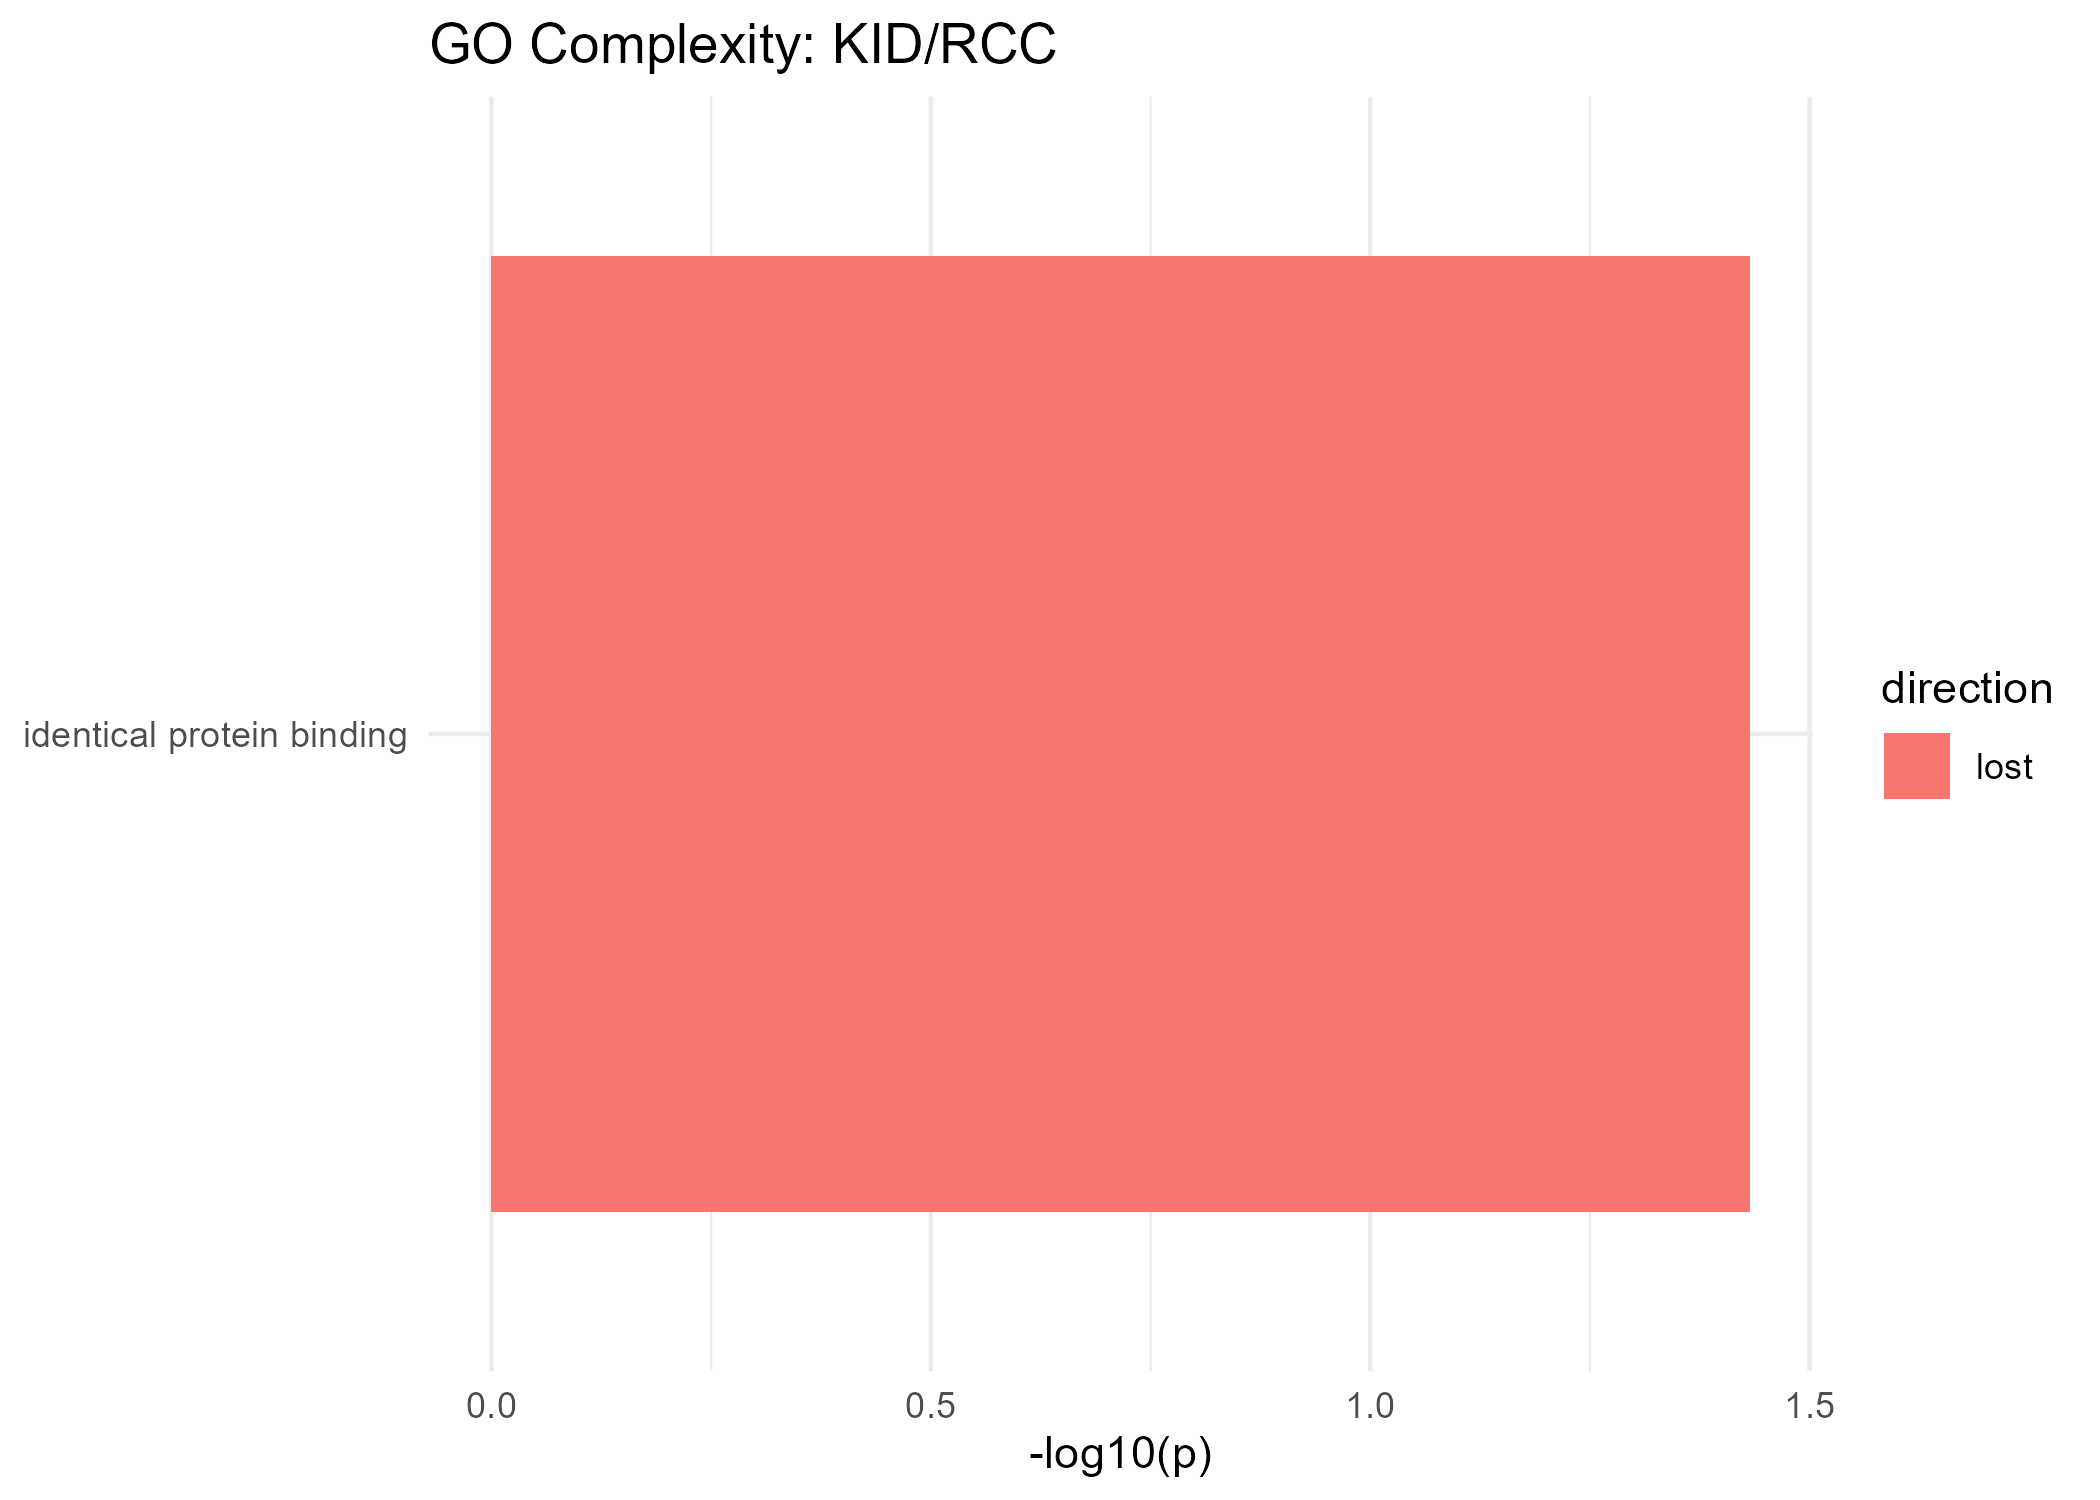
Lost Complexity
| GeneSet | p-value |
|---|---|
| identical protein binding | 0.037 |
Significant GO Molecular Function Terms (Spectral Entropy)
⚠️ Plot not available.No significant GO entropy terms found.
Significant KEGG Pathways (Complexity)
⚠️ Plot not available.No significant KEGG pathways found (complexity).
Significant KEGG Pathways (Spectral Entropy)
⚠️ Plot not available.No significant KEGG pathways found (spectral entropy).
Significant HALLMARK Genes (Complexity)
Lost Complexity
| GeneSet | p-value |
|---|---|
| HALLMARK_ESTROGEN_RESPONSE_LATE | 0.023 |
| HALLMARK_HYPOXIA | 0.012 |
Significant HALLMARK Genes (Spectral Entropy)
No significant MSigDB gene sets found (spectral entropy).